Most Important Point
Read the information they give you in the questions in section D.
Why? Section D is all about interpreting data and forming conclusions from what they give you. This is the bit that you don't need to have extensive science knowledge to answer.
Watch the video to see more on section D.
Why? Section D is all about interpreting data and forming conclusions from what they give you. This is the bit that you don't need to have extensive science knowledge to answer.
Watch the video to see more on section D.
The Basics
Section D is found at the end of the B2C2P2 exam paper and the B4C4P4 exam paper. It is always worth 10 marks. This is 5% of the total grade for your GCSE.
The answers are often found either in the question or by using a bit of common sense.
You will almost certainly be asked to interpret a table or a graph. Look for patterns: As one increases, what happens to the other.
You may be asked to plot a graph of data from a table. Think about scales and make sure you plot the points carefully.
Know how to calculate percentages. You may be asked to calculate the percentage of something from a table of data.
Example
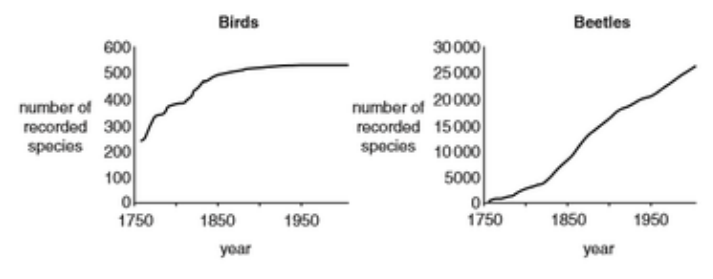
The number of species already discovered increases as time goes on. The graphs show the number of species of birds and beetles recorded in Europe since 1750.
Look at the two graphs.
Describe how the graphs for birds and beetles are similar and how they are different.
Look at the two graphs.
Describe how the graphs for birds and beetles are similar and how they are different.
